This will be a deeper dive look at analyzing data quality with Talend Open Studio using patterns, indicators, and rules.
Patterns
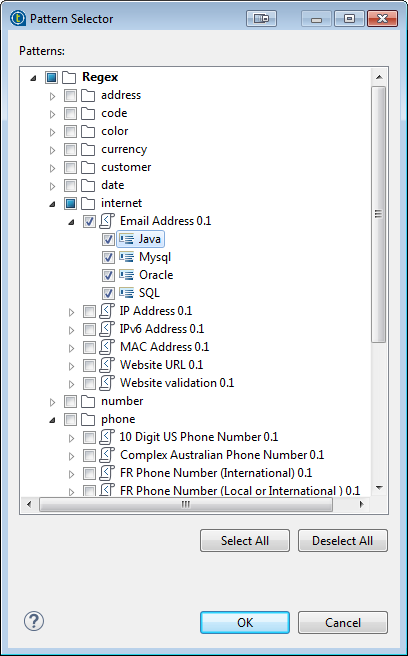
As described in my previous post, Talend performs basic column analysis which counts rows, nulls, duplicates, etc. However, one can also add pattern matching to this analysis, using either pre-built patterns or custom ones. The pre-built patterns include:
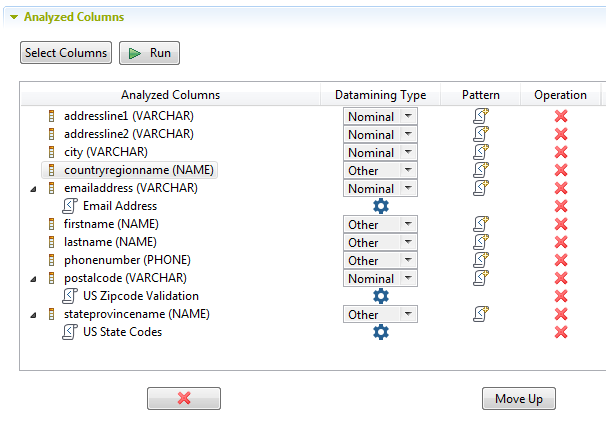
In our case, using the Adventureworks sample database on PostgreSQL, let’s match some attributes of the humanresources.vemployees view including email address, state codes, and zip code.
Here are the results of executing a simpler job, analyzing only email addresses:

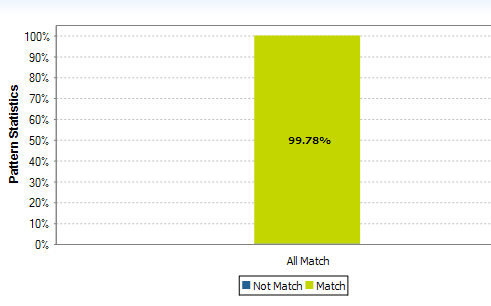
A bit of a hidden feature is to right-click on the stacked bar chart (‘matching’ section) to see the actual data rows that were flagged by this profiling rule.
Indicators
Talend provides additional profiling criteria named ‘Indicators’ which are defined in their Help Guide as:
Indicators can be the results achieved through the implementation of different patterns that are used to define the content, structure and quality of your data. Indicators represent as well the results of highly complex analyses related not only to data-matching, but also to different other data-related operations.
A number of such indicators are available in bundled libraries area:
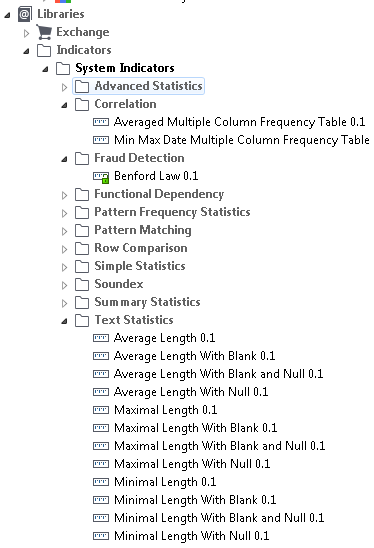
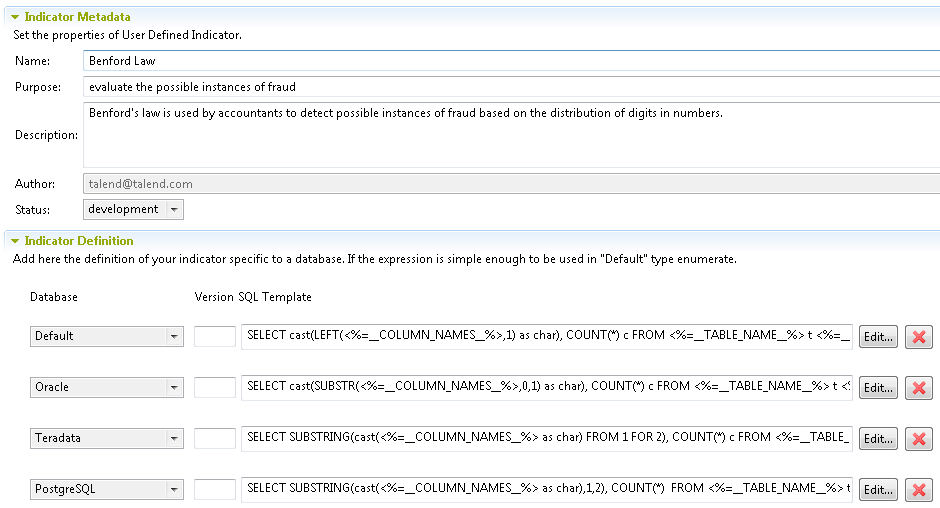
Here’s an example a database-specific indicator for fraud detection:
Rules
Talend offers two types of rules. The first are match rules, used to identify duplication within a data source and also to link records across data sources. Secondly, a set of SQL rules is available to flag records, possibly from a table join, meeting a certain criteria.
Match Rules
Custom match rules can be created in Talend to identify duplication. I hope to cover this feature more thoroughly in an upcoming post on Master Data Management.
SQL Rules
Talend’s ‘Table Analysis’ job can be executed with SQL-based profiling rules. The rules engine will issue SQL queries against the database to find records which meet the supplied criteria. Here’s a simple example of finding large sales orders in the sales.salesorderheader table:
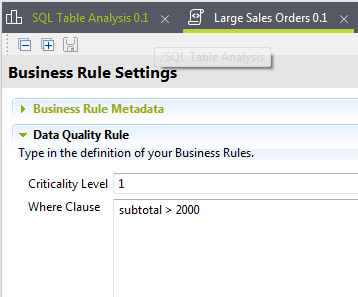
When run, this job returns a results listing showing that roughly 1/3 of sales orders exceed the $2000 threshold.

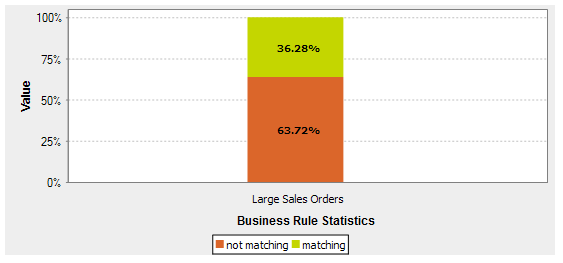
Again right-clicking on the stacked bar chart (‘matching’ section) shows the actual data rows that were flagged by this profiling rule.
Summary
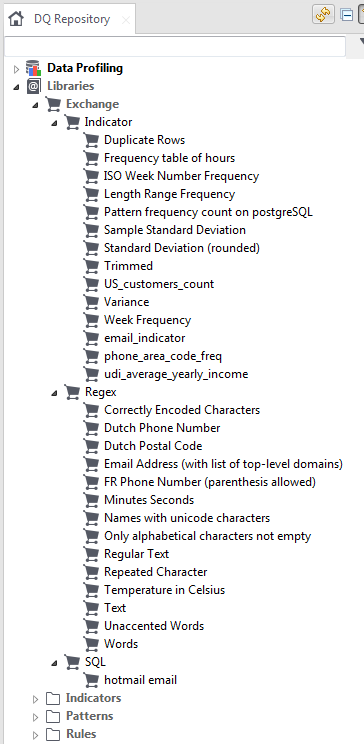
Talend ships with a default set of patterns, indicators, and rules. These can be added to in your project by defining your own. As well, one can import/export user-created libraries via the Exchange in the left-side project tree:
While it does take a while to become familiar with Talend Open Studio, it’s well worth the effort to gain a powerful tool in your data management toolbox.