Often overlooked, data quality is an essential pre-condition for successful data management initiatives. Poor quality source data will impact downstream analysis, visualization, matching, transfers, and search. Data quality profiling, monitoring, and improvement are key components in an overall data goverance strategy.
To assess quality, one must measure “the state of completeness, validity, consistency, timeliness and accuracy that makes data appropriate for a specific use”. Once assessed, data improvement (cleansing) processes can be put in place to maintain high data quality, as measured with ongoing monitoring.
Talend Data Quality
Talend offers an open-source (community) edition of their data quality product, known as Talend Open Studio. Built upon the Eclipse application platform, Talend Open Studio offers a number of quality analysis jobs against both databases and files.
Data Connections
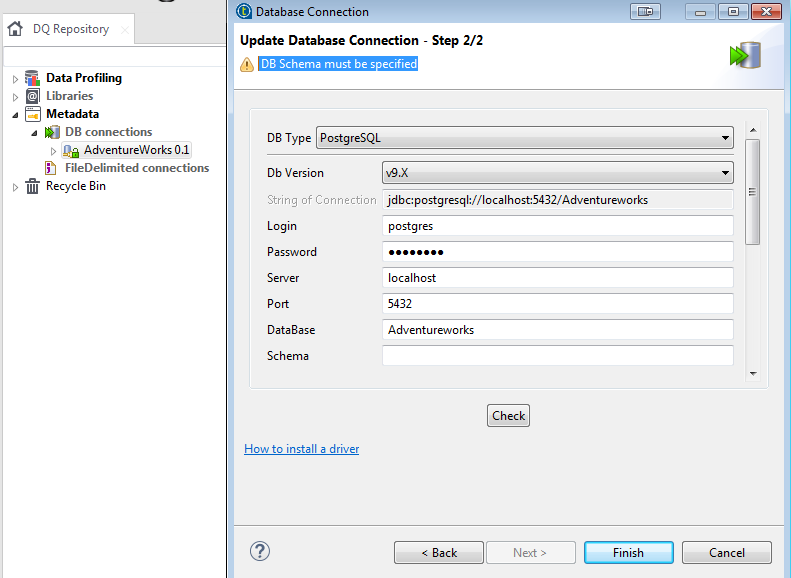
Once Talend is installed and running on your desktop, you’ll want to add connections to the data sources you wish to profile. Be sure to ‘Install Additional Packages’ under the ‘Help’ menu first to get all required database drivers.
In this case, I’m profiling the sales, human resources, and customer data in the Adventureworks sample database on PostgreSQL 9.6:
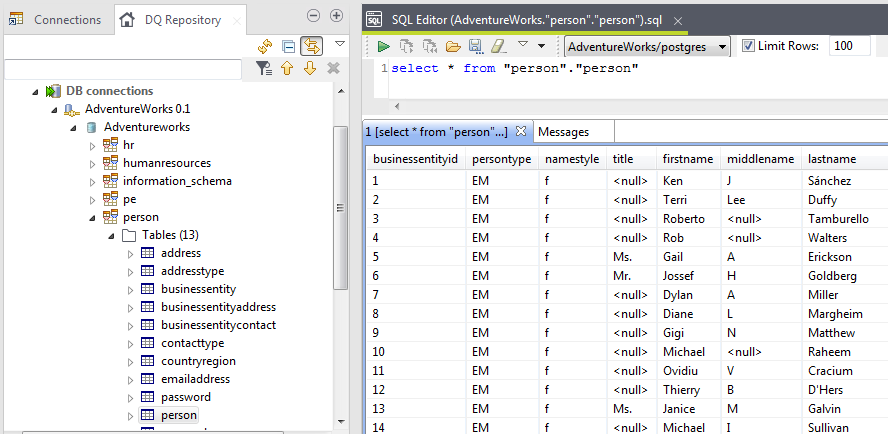
Once connected, Talend offers a nice Data Explorer perspective for working with the data:
Database Analysis
A first step in evaluating data is to get a high-level overview of it’s structure and content. Talend offers structural analysis jobs at the level of entire database, schema, catalog, and tables & views. Drilling down into the results shows row counts, schema counts, table counts, rows per table, views counts, rows per view, keys, and indexes.
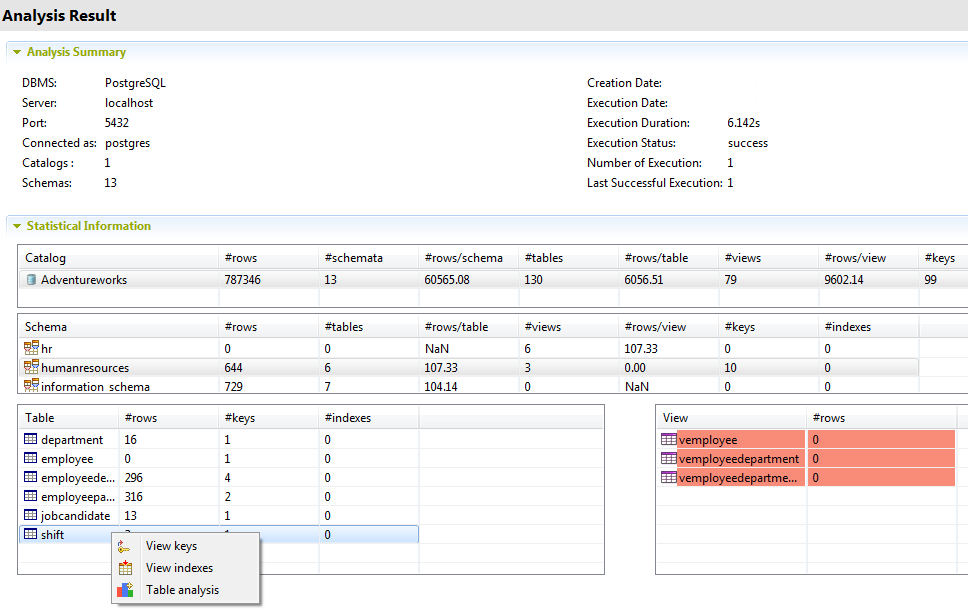
These results, combined with interviews of domain experts, should inform which tables become targets for more detailed analysis, outlined next.
Column Analysis
For tables & views of interest, a column analysis can be executed to show counts of rows, nulls, distinct, uniques, duplicates, and blanks (by default). Additionlly more complicated indicators can be added per column if needed. Here are the results for the person.person.firstname column:
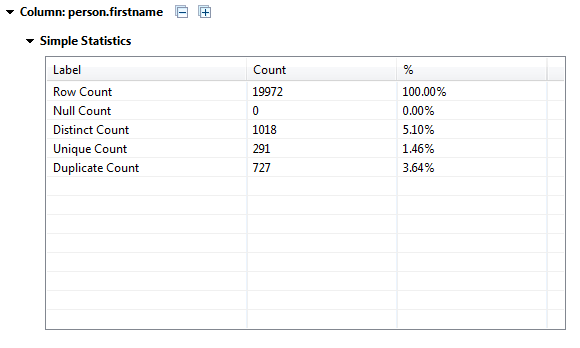
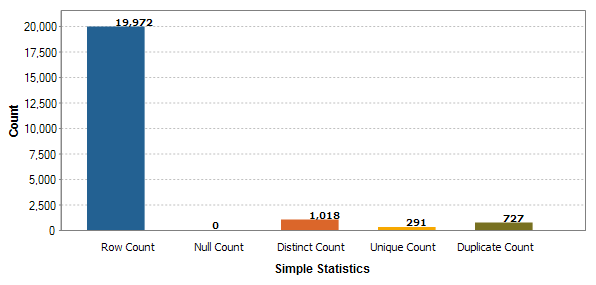
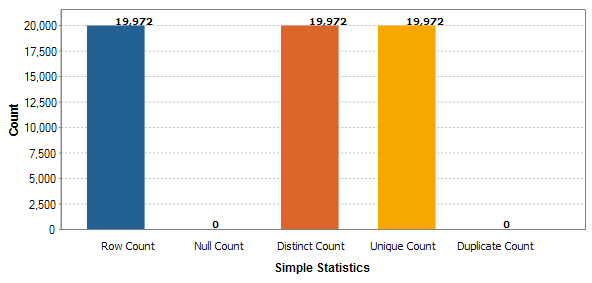
Nothing too worrying here as one would expect some duplicate first names. However, if one saw duplicates on the primary key column, that would be bad. In our case, the PK values are all unique for person.person.businessentityid:
Additionally, jobs which analyze nominal values, pattern frequencies, and numerical values are available. With these results, we now have insight into missing values, outlier values, and non-conforming values among others.
Duplication Analysis
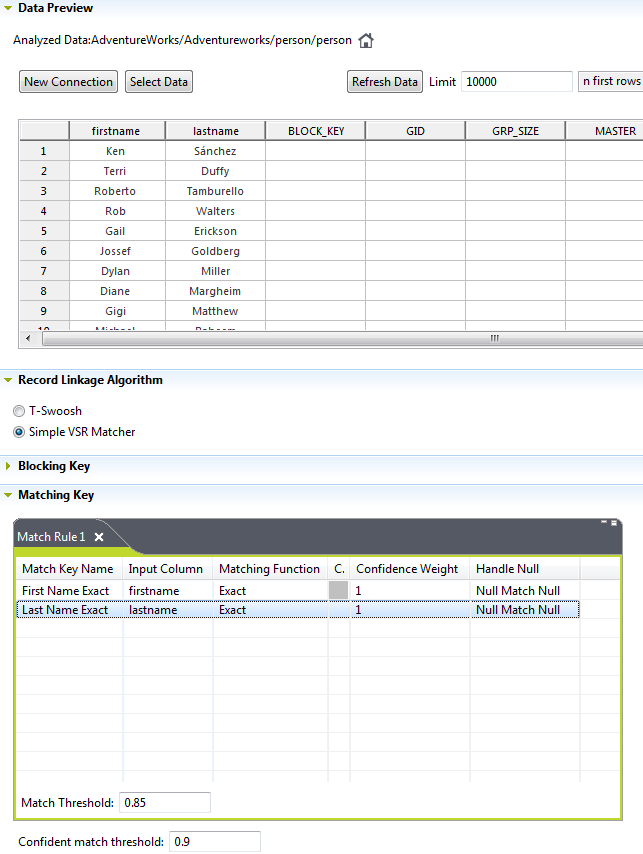
Having analyzed completeness, timeliness, validity, and accuracy of our data, we can now perform a duplication analysis. Using Talend’s ‘Match Analysis’ job on the person table, here is the job configuration for duplicates on first and last name. Two separate match algorithms are available, with configurable confidence and match thresholds.
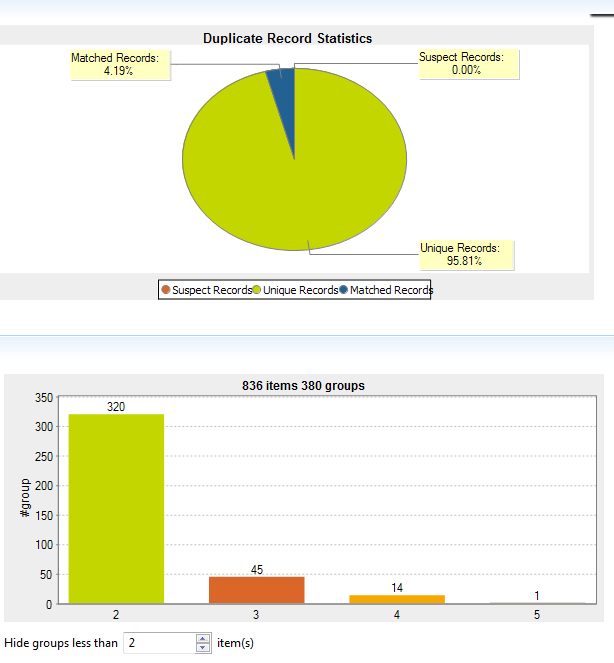
Executing this job, gives the following summary results below. As this table contains all people including customers and employees, some duplication is expected as the results show. A bit of a hidden feature is to right-click on the stacked bar chart (‘matching’ section) to see the actual data rows that were flagged by this match rule.
Talend also offers a Redundancy Analysis job for matching duplicated records across columns in a pair of tables, within the same schema. This can be useful in a denormalized database to find inconsistent redundant data.
Rules-based Analysis
So far, we’ve been using the mostly pre-configured jobs to analyze our data. For more customized profiling, Talend offers business rule analysis of table data. While powerful, this rules engine is more complicated so I’ll cover it’s configuration and use in an separate blog post.
Summary
For a tech-literate data manager, I think Talend Open Studio offers a compelling means to analyze a new data source, identify quality problems, allowing for cleansing processes to be put in place.
Strengths
The out of the box jobs provided by Talend are a great way to very quickly inspect data, finding problems that are often overlooked, until they surface in your business as corrupted workflows and untrusted reporting.
As well, it appears that analysis jobs can be tuned with multiple workers, allowing for concurrent execution. Default seems to be 5 connections opened and working per analysis job.
Areas for Improvement
This data quality tool offers only analysis capabilities, without means of effecting cleansing jobs. Depending on your data source, applying corrections directly in the source system may not be allowed for a quality tool. However, it would be nice to have the capability for cleansing in Talend Open Studio. As well, duplicates can be identified, but not automatically resolved.
The community edition of Talend Open Studio unfortunately only executes analysis jobs on demand from within the desktop studio. For those who need scheduled monitoring on the server, you would need to upgrade to their commercial version.
Given the importance of regular analysis, combined with an alert system and a web-based reporting, I think a compelling alternative for SQL pros would be the re:dash visualization tool, which I cover in an upcoming post.