As I expand support for additional blockchains on my Machinaris cryptocurrency platform, I have been able to compare and contrast the different Chia forks. A sub-branch of forks, based on Silicoin, introduced a staking component whereby farmers earn a proportionately higher block reward if they commit their coins for fixed time period.
Overall, this was an interesting addition in the Chia blockchain space. However, after multiple mistakes during the rollout, it became clear that the implementation had some serious drawbacks. This is seen even today as a handful Silicoin forks, namely the Ecostake, Gold, Petroleum, and Profit blockchains all exhibit a serious performance disadvantage. In particular, they all sync orders of magnitude slower than the pure Chia (and derived blockchains) which do not include this staking feature.
Profiling Python
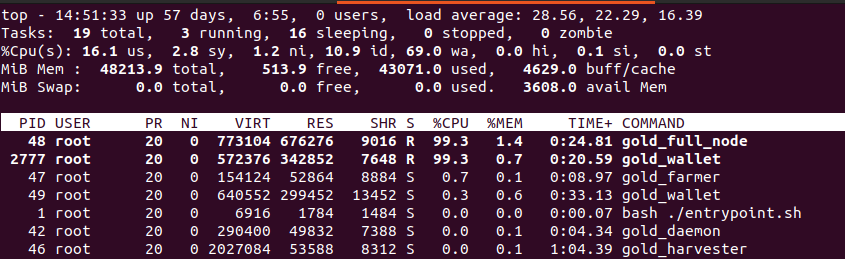
As I ran these forks within Machinaris, I wanted to know why the full_node process consistently took so much CPU-time to barely sync faster than real time. Here the top command shows the full_node process consuming a lot of CPU as it very, very slowly syncs the Gold blockchain:
So, facing this poor performance, I went looking for tools to profile Python code running within a Docker container. After trying various alternatives, I came across Py-Spy which had the compelling advantage of being able to attach to a running process without needing to instrument it at either install or run time. Very helpful as the Chia blockchains are all launched by complicated scripts.
Installing Py-Spy
This profiler is quickly installed with:
pip install py-spy
To run within a Docker container, one must enable the sys_trace capability. Either by adding --cap-add SYS_PTRACE to the docker run or enhancing your docker-compose.yml:
your_service:
   cap_add:
     - SYS_PTRACE
Profiling with Py-Spy
Once Py-Spy has been installed and enabled in the container, it’s quite easy to attach it to a running process and generate either an SVG image or a Speedscope file:
gold_pid=`pidof gold_full_node`
cd /code/testing/profiling/gold
py-spy record -o profile.svg --pid $gold_pid
py-spy record -f speedscope -o profile.ss --pid $gold_pid
Each py-spy command runs until you hit Cntrl-C to exit, at which point it will dump the recorded session into the output file. The SVG image can be opened directly, however I found inspecting the Speedscope session more useful. To view, just drop the profile.ss file onto this website in your browser: https://www.speedscope.app/
The resulting page allows one to clearly see which methods in the Python code are consuming the majority of the time:
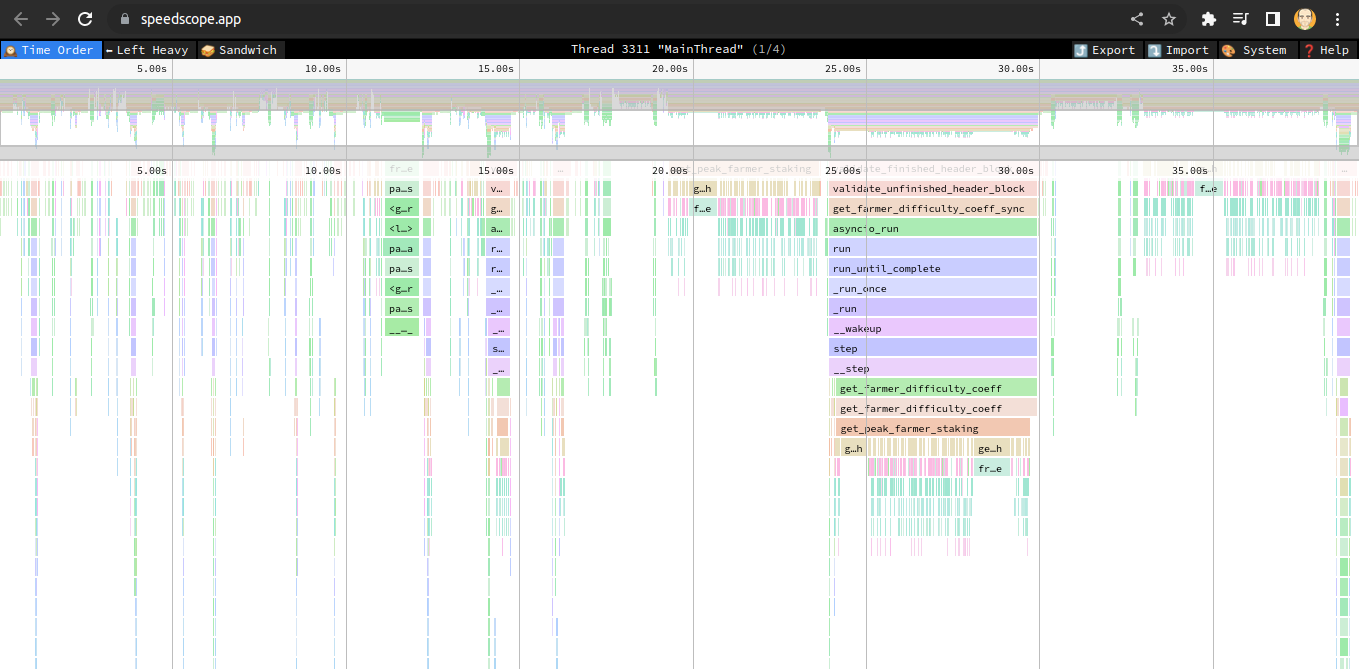
In the case of the full_node process of the Gold blockchain, I found that for every single block being validated during sync, the code was issuing a query against a Sqlite3 database to find the staked coins of each block’s farmer. These tables hold hundreds of thousands of records, and with each query being unique, were causing a huge overhead in order to validate a single block. Particularly as compared to the Chia blockchain which does not validate using this staking component (# of coins for a farmer).
With Py-Spy providing the source of the Gold blockchain’s slowness, I did try a few tricks to workaround this performance bottleneck. Unfortunately, none of them worked in a way that allowed the full_node to continue to validate blocks. So, I guess the Gold blockchain will will simply remain slow and I won’t bother farming it.
Conclusion
Overall, I was very impressed with ease of profiling Python programs that Py-Spy offers. While, finding the cause of a performance issue and actually solving it are two separate steps, I hope to use this tool on future Python projects.
More in this series…
- Chia on Unraid - Chia CLI on Unraid with Docker
- Machinaris - a new WebUI for Chia on Unraid
- Distributed Farming - Machinaris on many worker systems
- Network Peer Geolocation - Mapping location of blockchain peers by IP address.
- Internationalization - Internationalization of a Python web app