It was only weeks ago the world was worried about a US-Iran conflict and bushfires in Australia, and now a global pandemic has hit. Here in North America, most people were not paying attention to it and definitely aren’t ready for it. Count me in that large group, as I’m astounded at how fast events have been moving.
Here in the province of Alberta, we’ve now had the kids home from school for a full week. In theory, this coming week is “Spring Break”, but everything is closed and we’re likely to go into a full lockdown soon. Our boys are connecting with friends online, but definitely feeling cooped up.
Tracking the Spread
Overall, I understand that our provincial health agency is doing a good job with testing, at least compared to other jurisdictions in North America. They’ve been publishing daily stats showing total number of positive cases.
As you can see, in this snapshot, taken today - March 22nd, we’re definitely in the first stages of exponential spread. Keep in mind, this count reflects a multi-day lag in processing test samples, and obscures the likely fact that many more very mild cases in the community are never tested/counted.
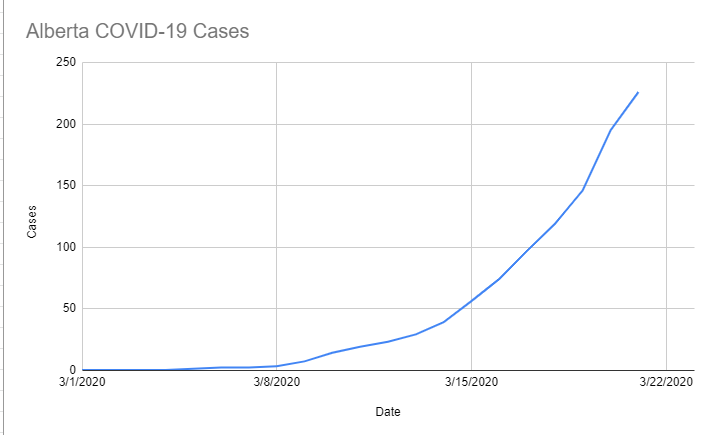
Below is an interactive chart of the latest data, which will be interesting to compare to the early snapshot above in the coming weeks and months:
Alberta Predictions
Some have started to make future predictions on infection spread, such as this spreadsheet I saw posted on /r/calgary, whch uses a doubling-rate of 3. I’m worried that they’re likely going to be accurate…
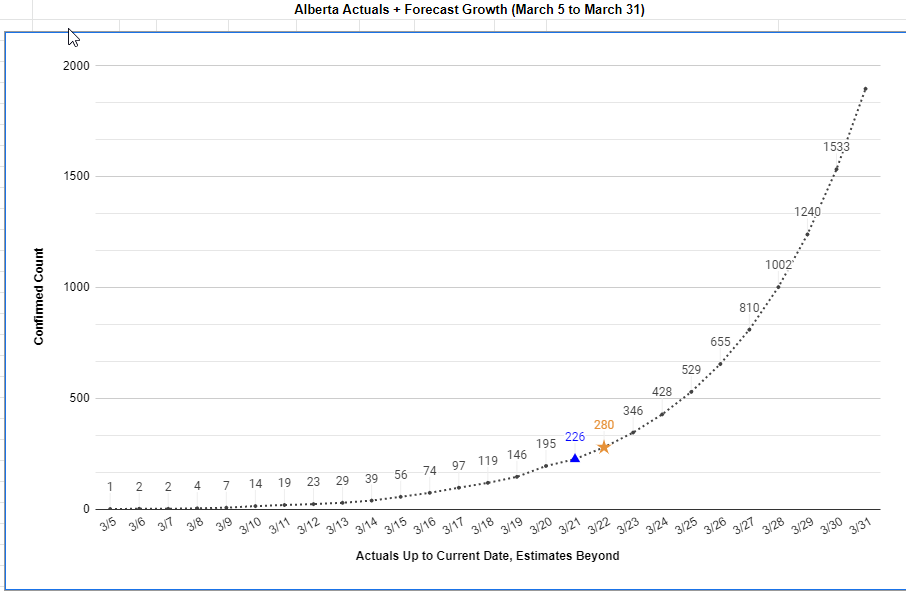
However I am hopeful that all the citizens of Alberta work together, while maintaining physical distance, to avoid the worst impacts from this new disease in the coming months.
Worldwide Visualizations
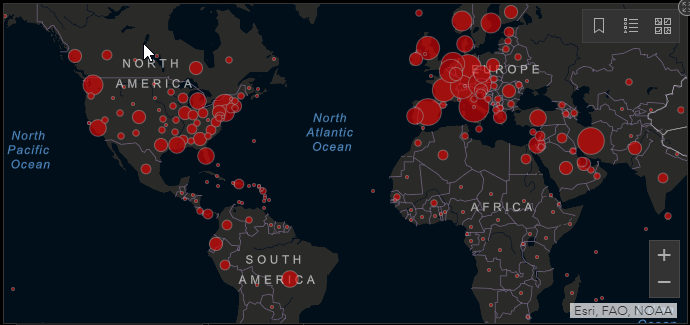
A good resource for monitoring the spread around the world has been this dashboard from Johns Hopkins University, snapshotted today:
Here’s a good visualization of the spread since mid-January, available from Wikimedia:

More Challenges
There are some interesting data science challenges being worked on at Kaggle which I may try if I find some time. However, with both working and schooling duties at home right now, things are pretty busy. We’ll see how it goes. Stay safe everyone!
Updates
Shortly after posting this, the Alberta government announced it would shift testing towards only serious cases. This acknowledgment of community spread, often by a large asymptomatic group of infected, means that the curves above are simply not reflective of true case counts.