Following this KDnuggets article, I will be trying to replicate road lane detection using the Python computer vision library, OpenCV. Here’s the sample image they used to detect lanes:
Setup OpenCV on Ubuntu
First off, I’m using OpenCV on Ubuntu 16.04 in Python 3, installed as follows:
sudo apt-get install build-essential cmake pkg-config
sudo apt-get install libjpeg8-dev libtiff5-dev libjasper-dev libpng12-dev
sudo apt-get install libavcodec-dev libavformat-dev libswscale-dev libv4l-dev
sudo apt-get install libxvidcore-dev libx264-dev
sudo apt-get install libgtk-3-dev
sudo apt-get install libatlas-base-dev gfortran
sudo apt-get install python2.7-dev python3.5-dev
sudo apt-get install python-opencv
sudo -H pip3 install opencv-python
Initial Codebase
My goal in this post was to evaluate the existing approach and test against more roadway images, retrieved from Google Images. Here’s the main method, see Github for more:
def process_image(dirpath, image_file):
    # First load and show the sample image
    image = mpimg.imread("{0}/{1}".format(dirpath, image_file))
    im = plt.imshow(image)
    plt.savefig('tmp/1.png')

    # Now convert the image to grayscale
    grayscaled = grayscale(image)
    im = plt.imshow(grayscaled, cmap='gray')
    plt.savefig('tmp/2.png')

    # Now apply a gaussian blur
    kernelSize = 5
    gaussianBlur = gaussian_blur(grayscaled, kernelSize)
    im = plt.imshow(gaussianBlur, cmap='gray')
    plt.savefig('tmp/3.png')

    # Now apply the Canny transformation to detect lane markers
    minThreshold = 100
    maxThreshold = 200
    edgeDetectedImage = canny(gaussianBlur, minThreshold, maxThreshold)
    im = plt.imshow(edgeDetectedImage, cmap='gray')
    plt.savefig('tmp/4.png')

    # Identify a region of interest... how to do this generically?
    lowerLeftPoint = [130, 540]
    upperLeftPoint = [410, 350]
    upperRightPoint = [570, 350]
    lowerRightPoint = [915, 540]
    pts = np.array([[lowerLeftPoint, upperLeftPoint, upperRightPoint,
    lowerRightPoint]], dtype=np.int32)
    masked_image = region_of_interest(edgeDetectedImage, pts)
    im = plt.imshow(masked_image, cmap='gray')
    plt.savefig('tmp/5.png')

    # Apply Hough Lines transformation
    rho = 1
    theta = np.pi/180
    threshold = 30
    min_line_len = 20
    max_line_gap = 20
    houghed = hough_lines(masked_image, rho, theta, threshold, min_line_len, max_line_gap)
    im = plt.imshow(houghed, cmap='gray')
    plt.savefig('tmp/6.png')

    # Finally overlay the detected lines on the original image
    colored_image = weighted_img(houghed, image)
    im = plt.imshow(colored_image, cmap='gray')
    plt.savefig('tmp/7.png')

    # Save a few more copies of last frame to cause a pause at the end before looping
    plt.savefig('tmp/8.png')
    plt.savefig('tmp/9.png')

    # Now generate an animated gif of the image stages
    image_name = os.path.splitext(image_file)[0]
    subprocess.call( ['convert', '-delay', '100', '-loop', '0', 'tmp/*.png', "output/{0}.gif".format(image_name) ] )
    shutil.rmtree('tmp')
Evaluating Results
As you can see, identifying the region of interest (i.e. the roadway) in an image is basically hard-coded in the above initial code. This worked great for the one “happy path” image as shown here:
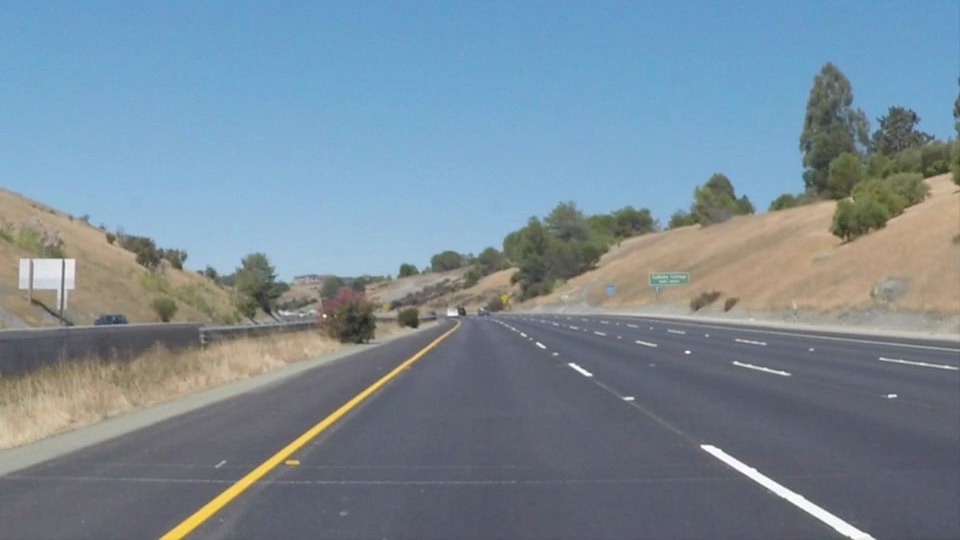
 Running this code against other dashcam shots from Google Images, I found some interesting results:
Clearly you would not want this lane detection algorithm driving your car! The color selection of the lines is too stringent. Also the area of interest selection seems to be a problem here as the roadway is not being identified before the attempt to overlay lane markers.
Next Steps
Having discovered the limits of simple lane detection with naive area-of-interest determination, I hope to improve upon this approach in the future.
More in this series…
- Improved Lane Detection - improved approach.
- Handling Dashcam Footage - processing video.
- Deploying in Docker - bundling as a Docker image.
- Running on Google Cloud - scaling on GKE.
- Running on Microsoft Cloud - scaling on Azure.